
An option chain is a tool that provides a list of all available options contracts for a specific underlying asset. It displays the current market prices and other important information about each option, including the strike price, expiration date, bid-ask spread, and implied volatility.
Table of Contents
What is Option chain
The option chain is typically organized in a table format, with each row representing a specific option contract, and each column representing a different piece of information about the option.
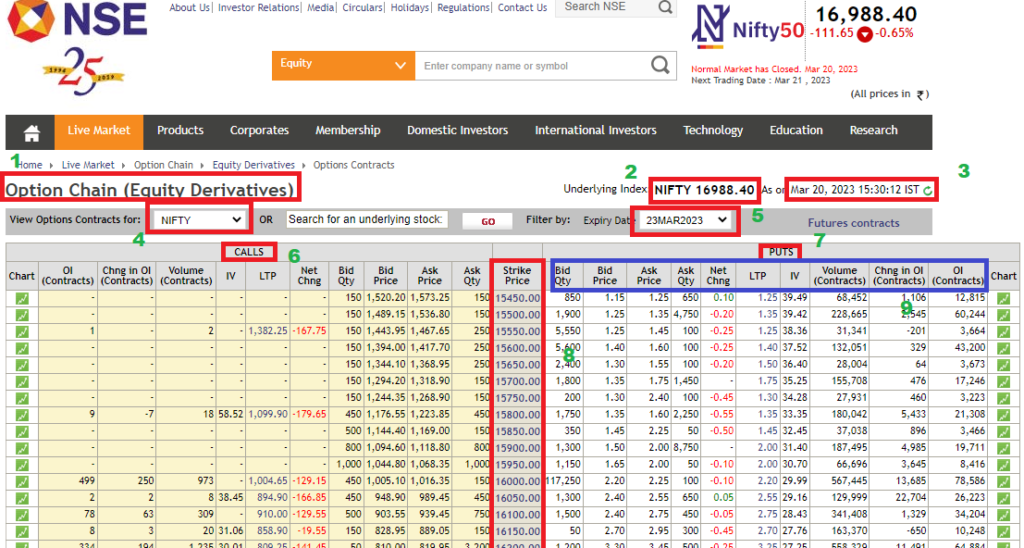
Here is an option chain taken from NSE website.
The option chain can be accessed from NSE using the link below:
https://www1.nseindia.com/live_market/dynaContent/live_watch/option_chain/optionKeys.jsp
Option chain and its components
The important components of the option chain are marked in red colour boxes and each of them are numbered in green colour. Let us now understand each of these numbered option chain components in detail.
- Option Chain (Equity Derivatives): Indicates that this is the Option Chain for the Equity Derivatives. Here Indices like Nifty, Bank Nifty and other stocks can be selected.
- Nifty 16988.4: Indicates that Nifty is currently trading at 16988.4. It is also called spot price of Nifty.
- Indicates date and time of the option chain. Since market closes by 15:30 hrs, this option chain image is showing the last traded time.
- Nifty is selected here indicating that this is an Option Chain for Nifty.
- Expiry Date: The expiration date is the date on which the option contract expires. In this case, 23Mar2023 is end date for expiry of the above options.
- Calls: Left side panel (peach background) of the Option Chain is related to Call options.
- Puts: Right side panel (white background) of the Option Chain is related to Put options.
- Strike prices: These are nothing but the Nifty prices. Currently, Nifty is at 16988.4. However, the beauty of Options is that they can traded at multiple price levels of Nifty which are called Strike prices.
- For example, though Nifty is at 16988.4, you can buy / sell 16000 put / call OR can buy / sell 18000 put / call.
- You can also observe that difference between two subsequent strike prices is 50.
- Bid Qty, Bid price, Ask price, Ask Qty, Net Chng, LTP, IV, Volume (Contracts), Change in OI (Contracts), OI (contracts)
- Bid price: The bid price is the highest price that a buyer is willing to pay for the option. For example, 2.2 is the bid price for put option (right panel of the Option chain) for 16000 strike price. Nifty lot size is 50. So, you will have to pay 50 * 2.2 = Rs.110 for buying one lot of Nifty 16000 put option.
- Bid Qty: Is the number of option shares (multiples of lots) bid by the buyers for a particular strike price. For example, 117250 is the bid Qty on put side (right panel of the Option chain) for 16000 strike price. That means there are total 117250 quantity of 16000 put option ready to be bought @ Rs.2.2 per share. One needs to spend 117250 * 2.2 = Rs.2,57,950/- for buying these many put options. This Rs.2.2 is called the Option premium.
- Ask price: The ask price is the lowest price that a seller is willing to accept for the option. For example, 2.25 is the Ask price for put option (right panel of the Option chain) for 16000 strike price. Nifty lot size is 50. So, you will get 50 * 2.25 = Rs.112.5 for selling one lot of Nifty 16000 put option. Here, you have sold the option pocketing the option premium i.e., Rs.112.5 by selling one lot of 16000 put option.
- Ask Qty: Is the number of option shares (multiples of lots) bid by the sellers for a particular strike price. For example, 100 is the Ask Qty on put side (right panel of the Option chain) for 16000 strike price. That means there are total 100 quantity of 16000 put option ready to be sold @ Rs.2.25 per share. The option seller will receive 100 * 2.25 = Rs.225/- for selling these put options.
- Net Change: Nifty 16000 put option fell by 0.1 which is therefore shown as -0.1.
- LTP: Is the Last Traded Price. For 16000 put option, LTP is 2.2.
- IV (Implied Volatility): Implied volatility is the market’s estimate of the underlying asset’s volatility over the life of the option. IV of the 16000 put option is 29.99. When Volatility increases due to some event like interest rate high, news events, budgets etc., Nifty is expected to move up and down quickly. In contrast, when volatility is low, Nifty is expected to move up or down slowly.
- Volume: Shows the total number of contracts that have been traded for that option during the current trading session. For 16000 put option, total 5,67,445 contracts are traded by the end of the day i.e., by 1530 hrs.
- OI (Open Interest): Represents the total number of outstanding contracts for that option. 78,586 contracts are outstanding by the end of the trading day.
- Change in OI (Change in Open Interest): Represents the contracts increased / decreased for that option during the trading day. For 16000 put option, change in OI is 13,685 contracts which means that 13,685 contracts increased (compared to previous trading day) during the current trading day. You can notice that change in OI for 16150 strike price is -650 contracts. That means, 650 contracts decreased (compared to previous trading day) during the current trading day.
Also read: Get to know Options Buying in simple terms…
The option chain can be used to identify potential trading opportunities, as well as to monitor the market activity for specific options contracts. Traders can use the information provided in the option chain to evaluate the risk and reward potential of different options strategies, and to make informed trading decisions.
Open an account with the leading Broker in India and start trading in options


Pingback: Option pricing - NSE Options