
Table of Contents
Havells India – About
Havells India is a renowned player in the Fast Moving Electrical Goods (FMEG) industry, offering a wide range of electrical products. With a robust global presence, Havells is recognized as a major manufacturer of power distribution equipment. The company’s consistent growth trajectory is evident as it strives to achieve a remarkable revenue milestone of Rs 20,000 crore.
A notable aspect of Havells India is its commitment to manufacturing excellence. With 95 percent of its products produced in-house within India, the company adheres to high-quality standards. Havells boasts an impressive portfolio of 14 well-equipped factories, which facilitate efficient production processes.
One of Havells’ core strengths lies in its international reach. The company’s products are widely distributed in over 50 countries, showcasing its commitment to catering to diverse markets and meeting global demands. Havells India has earned a strong reputation for its innovative solutions, reliability, and exceptional performance.
With its focus on technological advancements and customer satisfaction, Havells India continues to set new benchmarks in the electrical industry.
Havells India – Growth prospects & future plans
Company is embarking on a significant expansion plan in its manufacturing operations.
New Refrigerator Manufacturing Facility in Ghiloth: The company is in the process of setting up a new manufacturing facility in Ghiloth, with a planned capacity of 1 million refrigerator units. This facility is expected to become operational by Q1FY26. The company expects to benefit from backward integration (possibly sourcing raw materials internally) and economies of scale as production ramps up.
Expansion in South India: Since most of the company’s manufacturing facilities are located in North India, the management plans to establish two greenfield facilities in South India:
- Sri City, Andhra Pradesh: One of the new facilities will be in Sri City, Andhra Pradesh.
- Tumkur, Karnataka: The Tumkur plant will have an expanded capacity for cables and wires production. Company is diversifying its product portfolio or increasing production in this specific product category in the southern region.
The company’s strategic focus is on diversifying and expanding its presence across various aspects of its business operations.
- E-commerce Presence: The company is actively working on increasing its presence in the e-commerce sector.
- Deeper Penetration in India: Initiatives like the “Rural Vistaar” program, which likely aims to expand its customer base in rural areas of India.
- B2B Projects: The company is increasing its participation in business-to-business (B2B) projects.
- Expanded Footprint in International Markets

Havells India – Stock details & ratios
Here’s a breakdown of the financial and market-related information for the company:
- Market Capitalization (Market Cap): ₹87,700 Crores – This represents the total market value of the company’s outstanding shares and is a measure of its overall worth in the stock market.
- Current Stock Price: ₹1,399 – The current trading price of one share of the company’s stock in the market.
- 52-Week High/Low: ₹1,466 (High) / ₹1,024 (Low) – These values represent the highest and lowest stock prices the company’s shares have reached over the past 52 weeks.
- Stock Price-to-Earnings Ratio (P/E): 78.6 – The P/E ratio indicates how much investors are willing to pay for each rupee of earnings generated by the company. A higher P/E ratio suggests that investors have high expectations for future growth.
- Book Value: ₹106 – The book value per share represents the net asset value of the company per share. It is the value of the company’s total assets minus its total liabilities divided by the number of outstanding shares.
- Dividend Yield: 0.54% – This is the annual dividend income as a percentage of the current stock price. A lower dividend yield indicates that the company may not pay out a significant portion of its earnings as dividends.
- Return on Capital Employed (ROCE): 22.3% – ROCE is a measure of the company’s efficiency in generating profits from its capital investments.
- Return on Equity (ROE): 17.0% – ROE measures the company’s profitability in relation to shareholders’ equity. It shows how effectively the company is using shareholders’ funds to generate profits.
- Face Value: ₹1.00 – This is the nominal value of a share as specified by the company when it issued its shares.
- Debt to Equity Ratio: 0.03 – This ratio indicates the proportion of the company’s financing that comes from debt (0.03 or 3%) compared to equity. A low debt-to-equity ratio generally indicates lower financial risk.
- Capital Work in Progress (CWIP): ₹166 Crores – CWIP represents the cost of assets that are currently in the process of being constructed or developed but not yet completed.
- Operating Profit Margin (OPM): 9.37% – OPM is a measure of the company’s profitability, indicating the percentage of revenue that remains as operating profit after deducting operating expenses.
- Pledged Percentage: 0.00% – This indicates the percentage of promoter or major shareholder’s shares that have been pledged as collateral for loans. A pledge percentage of 0% suggests that no shares have been pledged in this case.
Havells India – Technical analysis
Financial performance of the company for the quarter ended June, along with the year-on-year (YoY) growth percentages:
- Consolidated Net Profit (Q2): Rs 287.07 crore
- YoY Growth: Up 18% from Rs 243.16 crore in the year-ago period.
- Consolidated Revenue from Operations (Q2): Rs 4,833.80 crore
- YoY Growth: Up 13.8% from Rs 4,244.46 crore in the year-ago period.
Below is the price chart of Havells India:
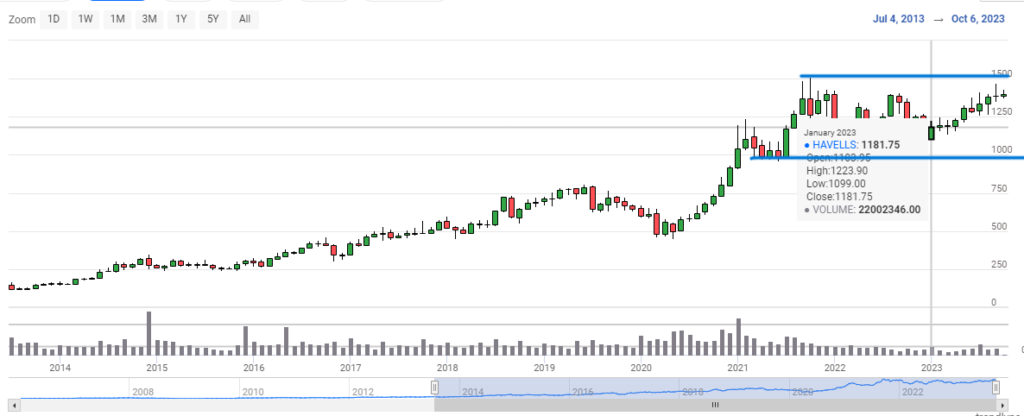
From the price action, it can be noted that, stock has been in range bound condition (price moving between two blue coloured lines) for the last two years. It has not given any return despite its good financial performance.
Given the company’s future growth prospects, the stock is expected to give at least 20 to 30% return in the short term.
Following are various technical indicators to assess trends, momentum, and potential buying or selling signals.
| Indicator | Value |
|---|---|
| RSI (Relative Strength Index) | 53.8 |
| MACD (Moving Average Convergence Divergence) | 10.8 |
| MFI (Money Flow Index) | 46.3 |
| MACD Signal Line | 14.6 |
| ADX (Average Directional Index) | 15.8 |
| ATR (Average True Range) | 30.6 |
| Commodity Channel Index (CCI) | -1.9 |
| ROC125 (Rate of Change, 125 periods) | 16.5 |
| ROC21 (Rate of Change, 21 periods) | 3 |
| Williams %R | -56.8 |
Also read: Have a look at the following story:

Disclaimer:
This is not a stock recommendations. All efforts have been made to correctly represent facts and figures in the post. The website or its management is not responsible for any kind of losses arising out of Investing in equities. Investors must therefore exercise due caution while investing or trading in stocks. NSE Options.in or the author are not liable for any losses caused as a result of the decision based on this article. Please consult your investment advisor before investing

